Overview
Page Generator Pro can log the result of each Page and Term Generation.
Most of the time you won’t need to enable or use these Logs – however, they’re useful as confirmation that Page Generator Pro generated Pages / Terms, or if you require a log of generated Pages / Terms in CSV format, for use in a third party analytics or reporting tool.
Enable Logging
By default, Page Generator Pro’s logging is disabled. To enable it:
- In your WordPress Administration interface, navigate to Page Generator Pro > Settings
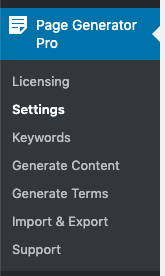
- Click the Generate tab.
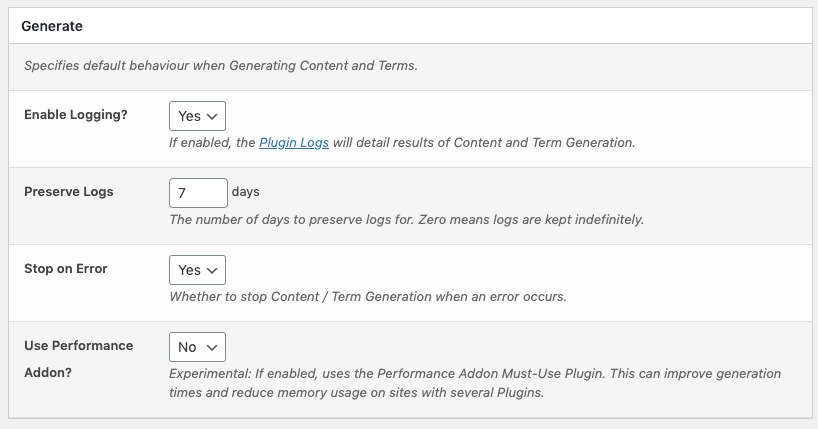
- Set Enable Logging = Yes
- Click Save
View Logs
To view the Logs, click on Page Generator Pro > Logs in the WordPress Administration interface: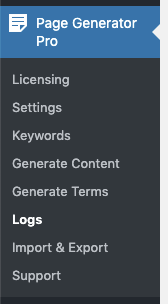
A table will be displayed, showing all generation activity, ordered newest to oldest: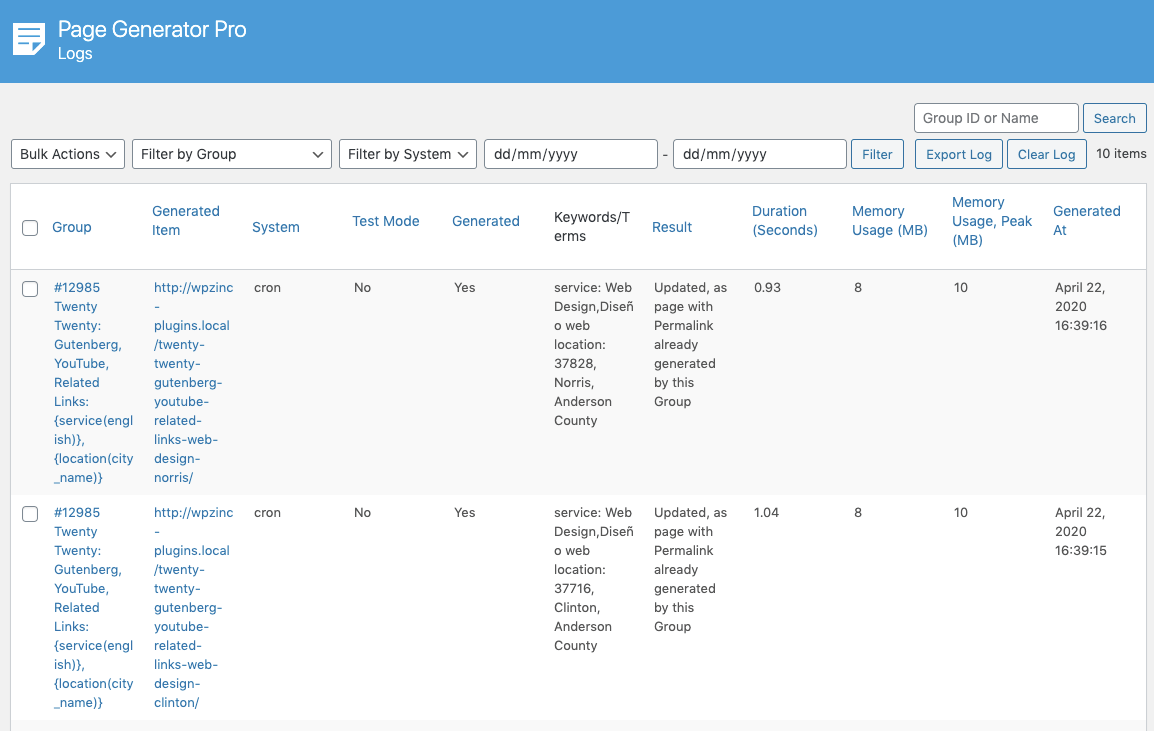
Understanding Log Entries
Each log entry comprises of the following information:
| Column | Description |
|---|---|
| Group | The Group ID and Name. Clicking this will filter the Logs to only show results for this Group. |
| Generated Item | The URL of the generated Page or Term. |
| System |
|
| Test Mode | Whether generation took place in Test Mode |
| Generated |
This will depend on the settings defined in the Content Group. |
| Keywords/Terms | A list of the Keywords detected in the Content Group, and the Term(s) used as their replacements for this generated item. |
| Result |
|
| Message | Refer to the Understanding the Result Log section below. |
| Duration (Seconds) | How long, in seconds, Page Generator Pro took to generate this item. Refer to the Performance Documentation to understand this number in more detail. |
| Memory Usage (MB) | The amount of memory the server used to generate this item. |
Understanding the Result Log
When using Generate via Browser, Generate via WP-CLI or reviewing the Logs section of Page Generator Pro, each generated item returns a message detailing what action was performed. This message will depend on the Overwrite setting used on a Content Group:
| Result | Description | Overwrite Setting that may produce this Message |
|---|---|---|
| Created [Permalink] | A new Page has been created at the given Permalink. | (any) |
| Created, as [Post Type] with Permalink has not yet been generated by this Group [Permalink] | A new Page has been created, as no existing Page generated by this Group was found for the given Permalink. |
|
| Updated, as [Post Type] with Permalink already generated by this Group [Permalink] | An existing Page has been updated, as an existing Page generated by this Group was found for the given Permalink. |
|
| Created, as [Post Type] with Permalink does not exist in WordPress [Permalink] | A new Page has been created, as no existing Page was found for the given Permalink. |
|
| Updated, as [Post Type] with Permalink already exists in WordPress [Permalink] | An existing Page has been updated, as an existing Page was found for the given Permalink. |
|
| Skipped, as [Post Type] with Permalink already generated by this Group [Permalink] | Generation of this Page has been skipped, as an existing Page generated by this Group was found for the given Permalink. | No, skip if existing Page generated by this Group |
| Updated, as [Post Type] with Permalink already exists in WordPress [Permalink] | Generation of this Page has been skipped, as an existing Page was found for the given Permalink. | No, skip if existing Page exists |
If a blocking error occurred, its message will be displayed in this field.
Viewing Group-specific Logs
To view logs for a specific Group, either:
- Select the Group from the Filter by Groups dropdown:

- Enter the Group ID or partial Group Title in the search box, and click the Search button:

A table will be displayed, showing Log Entries matching the Group ID or partial Group Title
Filtering Logs
Logs can be filtered by:
- Group
- System
- Result
- Generated At Date Range
To filter the logs, click on the relevant filter above the table, selecting the applicable value:
Click the Apply button to see the filtered logs.
Define Table Columns to Display
By default, all Log Entries’ attributes are displayed on screen:
You can adjust which columns of data to display by:
- Clicking the Screen Options tab at the top right of the screen:

- Check or uncheck the relevant columns to display/hide:

- Click the Apply button
Define Number of Logs per Page
By default, up to 20 Log Entries are displayed on screen before pagination is then output, allowing you to paginate through your Logs:![]()
You can adjust the number of Log Entries per Page by:
- Clicking the Screen Options tab at the top right of the screen:

- Enter the number of Log Entries to display per Page:

- Click the Apply button
Exporting Logs
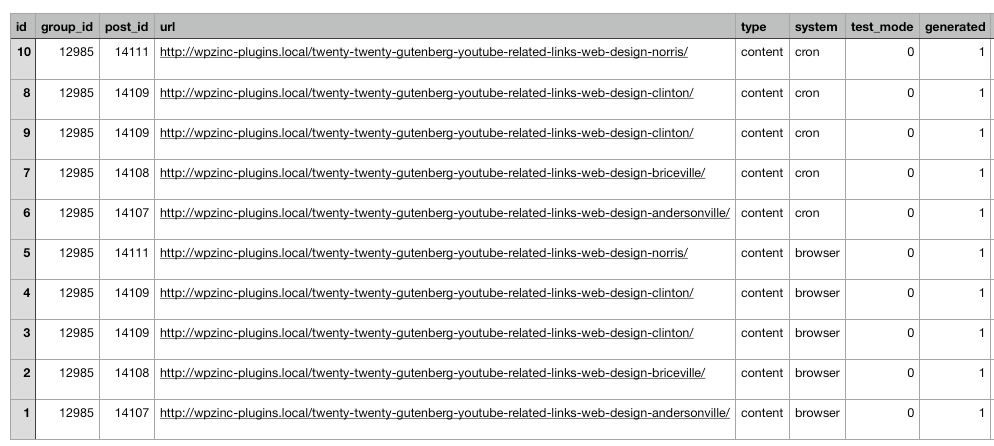
To export all log entries on screen to a CSV file:
- Define any Filters that you want to apply to the log entries above.
- Click the Export Log button to export the filtered results to a CSV file.
Delete Log Entries
To delete one or more log entries:
- Click the checkbox beside each log entry in the table:
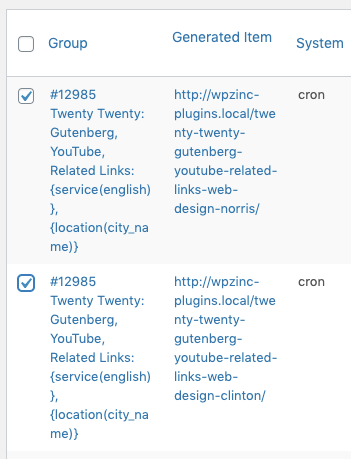
- Under Bulk Actions, select Delete:

- Click the Apply button
Clear Log
To delete all log entries:
- Click the Clear Log button

- Confirm that you want to clear all Log Entries
